Too many foundation designs in Portsmouth treat the city as a single seismic zone, importing generic bedrock spectra that ignore the Wittering Formation clays and the loose drift deposits beneath Southsea. The reality is that a site in Hilsea sitting on London Clay does not shake the same way as a waterfront plot underlain by alluvial silts and made ground near the Camber Docks. We see this mismatch in tender-stage ground models regularly: a uniform hazard spectrum applied across the whole Portsea Island without accounting for impedance contrasts or basin-edge effects. Seismic microzonation bridges that gap by mapping how local geology modifies bedrock motion, producing site-specific amplification factors and response spectra that feed directly into structural analysis. The work draws on BS EN 1998-1:2004 and the BGS superficial thickness maps, combined with field shear-wave velocity profiles measured through MASW surveys and borehole SPT drilling to constrain the top 30 metres. The result is a layered ground model that the design team can use with confidence, rather than relying on default site classes that may under-represent amplification in Portsmouth’s softer near-surface formations.
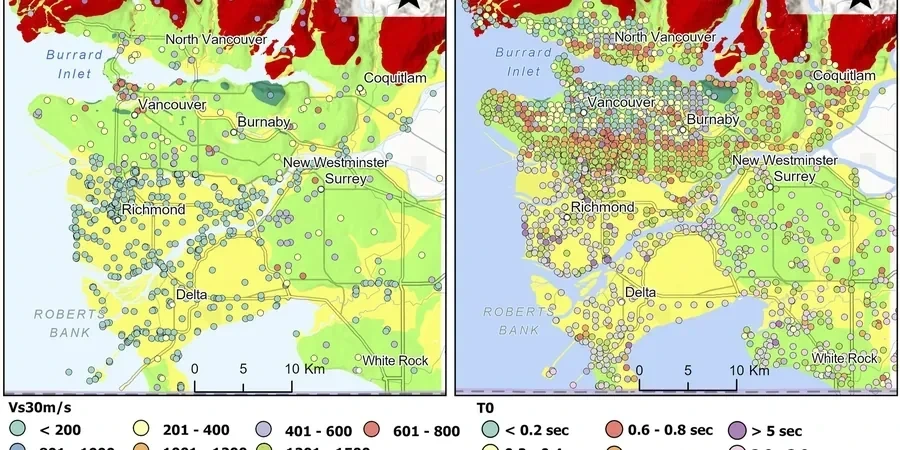
Portsmouth’s thin Quaternary cover creates sharp Vs contrasts: 180 m/s in alluvium can jump to 500 m/s in chalk within 15 metres, driving amplification that generic site classes miss.
Process overview
Local context
The Wittering Formation and overlying Brickearth that underlie much of Portsmouth are stiff in their intact state, but the harbour margins and the eastern shore of Portsea Island conceal thick sequences of Normandiense silts and historic made ground that can amplify short-period motion by a factor of 2 to 3 relative to the chalk reference. The 2019 Newdigate sequence in Surrey, while distant, reminded southern England that intraplate seismicity is real, and a magnitude 5 event centred in the English Channel would load Portsmouth’s soft soils far more than a distant continental quake. Ignoring site effects means underestimating spectral accelerations at periods that coincide with mid-rise residential and commercial buildings—the very typology dominating Portsmouth’s current development pipeline. A microzonation study also protects the developer from claims of inadequate ground characterisation under CDM 2015, because it demonstrates reasonable inquiry into foreseeable ground hazards. Lenders and insurers increasingly request this level of seismic due diligence for schemes above £10 million in the South East, and Portsmouth, with its exposed coastal position and complex superficial geology, sits squarely in that bracket.
Reference standards
BS EN 1998-1:2004 (Eurocode 8 Part 1), BS EN 1997-2:2007 (Ground investigation and testing), BS 5930:2015+A1:2020 (Code of practice for ground investigations), SESAME European research project guidelines (WP12, 2004)
Additional services
Shear-wave velocity profiling
Direct Vs measurements via downhole geophysics in boreholes and surface MASW arrays, processed to yield layer velocities and the Vs30 value required for Eurocode 8 site classification. Portsmouth’s shallow chalk demands careful picking of refracted arrivals.
Site response analysis
1D equivalent-linear modelling in DEEPSOIL, using modulus reduction and damping curves matched to local London Clay, Brickearth and Chalk Formation materials. We input scaled bedrock motions from UK-specific stochastic simulations.
Microzonation mapping and reporting
GIS-based maps of amplification factors, spectral accelerations at 0.2 s and 1.0 s, and site class boundaries across the development footprint. The report includes a clear CDM 2015 risk register entry and actionable recommendations for the structural engineer.
Typical parameters
Quick answers
What does seismic microzonation cost for a typical Portsmouth development site?
For a single-site study on Portsea Island, seismic microzonation typically falls between £3,100 and £12,700 depending on the number of measurement points, borehole availability, and whether 2D basin modelling is required. A straightforward 1D analysis with one MASW line and an existing borehole log sits at the lower end; a multi-hectare regeneration site needing several Vs profiles, resonant column tests on local soils, and 2D modelling moves toward the upper range.
How does microzonation differ from a standard site class determination under Eurocode 8?
A standard site class determination simply assigns a letter (A through E) based on Vs30 or N60, which then scales a single design spectrum. Microzonation goes further: it maps how different parts of a site will amplify motion at different periods, producing custom spectra per zone rather than one generic envelope. This matters in Portsmouth where alluvium thickness can change by 10 metres across a single city block.
Is seismic microzonation required for Portsmouth developments given the UK’s low seismicity?
Statutory requirement depends on the building type and consequence class, but BS EN 1998-1 applies across the UK and Portsmouth falls within the low-to-moderate hazard zone where site effects dominate the risk profile. For Importance Class III and IV structures, and increasingly for large residential schemes where insurers or funders demand it, microzonation is becoming standard practice rather than an optional extra.
What input motion do you use for Portsmouth site response analysis?
We select bedrock acceleration time histories consistent with the UK seismic hazard model published by the British Geological Survey, scaled to the 475-year and 2,475-year return periods as required by the project. Time histories are matched to the Eurocode 8 Type 2 spectrum for the region, and we often run sensitivity cases using both real records from stable continental regions and stochastic simulations to bound the uncertainty.