One of the most costly mistakes we see in Portsmouth’s redevelopment zones is assuming a uniform chalk bedrock depth across a site. The city’s underlying geology is far from predictable—buried drift-filled channels and solution features in the Lewes Nodular Chalk can create sudden drops in competent rock that standard borehole grids simply miss. When a piling contractor encounters a 4-metre deep clay-filled dissolution pipe between two perfectly sound boreholes, the resulting redesign delays and variation orders eat straight into the contingency budget. Seismic tomography—both refraction and reflection—closes this gap by delivering a continuous subsurface velocity profile between control points. The method works by measuring the travel time of seismic waves generated at the surface and refracted or reflected at geological boundaries, allowing our team to map the chalkhead interface, identify fractured zones, and assess rippability across the entire footprint before a single excavator arrives on site. In Portsmouth’s densely built-up areas, where access constraints limit intrusive investigation, this non-invasive approach often becomes the only practical way to connect the dots between boreholes and build a defensible ground model for foundation design.
A continuous seismic velocity profile across the site connects borehole control points and reveals buried chalk dissolution features that isolated boreholes inevitably miss.
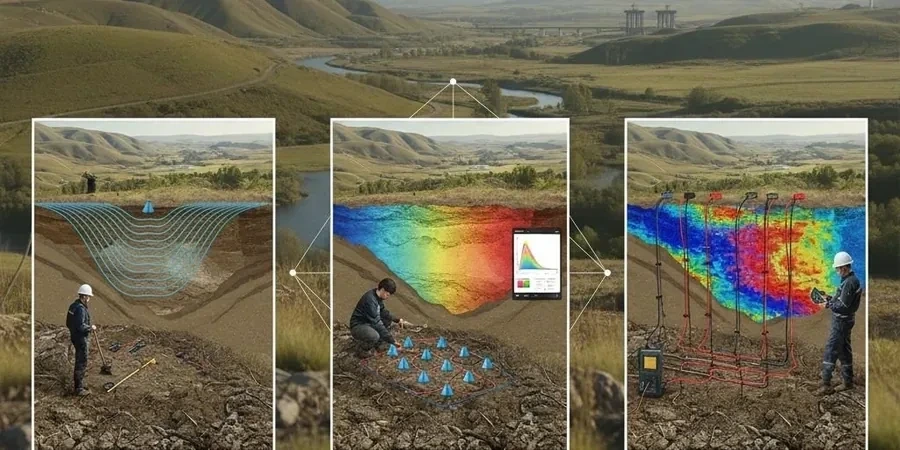
Process overview
Local context
Portsmouth’s post-war reconstruction saw extensive backfilling of former tidal creeks and dock basins—most notably around the Continental Ferry Port and the former Town Camber—with a heterogeneous mix of dredged silt, brick rubble, and ash that compacts unpredictably and masks the true chalkhead topography. Seismic tomography cuts through this ambiguity because the velocity contrast between the low-velocity fill (typically 400–800 m/s) and the underlying chalk (1800–2400 m/s depending on fracturing) is unambiguous and mappable. Where the chalk contains flint bands or marl seams, the reflection component picks up intra-formational boundaries that influence pile toe levels and shaft friction calculations. In the northern suburbs along the Portsdown Hill escarpment, the chalk dips southward beneath the Palaeogene cover, and the refraction method identifies the sloping bedrock surface that governs slope stability and retaining wall design. The biggest single risk on Portsea Island remains undetected dissolution features—these can open beneath a loaded foundation and trigger differential settlement that no amount of structural reinforcement can arrest. A well-executed tomography survey, combined with targeted test pits to ground-truth the velocity boundaries, transforms an otherwise speculative ground investigation into a calibrated engineering model.
Reference standards
BS 5930:2015 + A1:2020 — Code of practice for ground investigations, BS EN 1997-2:2007 (Eurocode 7) — Ground investigation and testing, ASTM D5777-18 — Standard Guide for Using the Seismic Refraction Method, AASHTO R 13-12 — Standard Practice for Seismic Refraction Tomography
Additional services
Refraction Microtremor and MASW Combination
We pair active-source refraction tomography with passive-source MASW to derive Vs30 profiles for seismic site classification per BS EN 1998-1, essential for Portsmouth schemes requiring a dynamic soil-structure interaction analysis.
Cross-Hole and Down-Hole Seismic Tomography
For critical infrastructure where the highest resolution is demanded, we run cross-hole surveys between cased boreholes to image the inter-borehole plane with velocity accuracies better than 5%, resolving thin clay seams within the chalk that govern pile base resistance.
Rippability and Excavation Planning
Using the seismic velocity model calibrated against local chalk grades (Grade I through Grade VI per CIRIA C574), we produce rippability maps that tell the earthworks contractor exactly where the chalk can be ripped with a D8 dozer and where hydraulic breakers become unavoidable.
Typical parameters
Quick answers
What ground conditions in Portsmouth suit seismic refraction versus reflection?
On Portsea Island, refraction works well for mapping the depth to chalk through the superficial drift and Palaeogene cover, provided the chalk velocity exceeds the overburden velocity—which it typically does. Reflection becomes necessary when we need to image deeper structures within the chalk itself, such as faulting associated with the Portsdown Anticline, or where a low-velocity layer (like a saturated peat horizon) sits above faster material and creates a hidden-layer problem for refraction alone.
Can seismic tomography surveys be run on congested urban sites in Portsmouth?
Yes, and this is precisely where the method proves its value. We use a sledgehammer source rather than explosives, which eliminates vibration concerns near adjacent buildings and avoids triggering Section 61 noise complaints. The geophone spread can be oriented along pavements, service corridors, or within demolition footprints. Where traffic management is required—for example along Commercial Road or near the ferry terminal—we coordinate with the council’s highways team and schedule acquisition during off-peak hours.
How much does a seismic tomography survey cost for a typical Portsmouth development site?
For a standard residential or commercial plot on Portsea Island, a seismic tomography survey typically falls between £2,450 and £4,200 depending on the number of profile lines, the target depth, and the acquisition method. A single 69-metre refraction line with 24 geophones and sledgehammer source falls at the lower end; a multi-line survey with reflection processing and a full interpretive report incorporating borehole calibration moves toward the upper end of that range.
What deliverables do we receive from a tomography survey?
The standard reporting package includes a site plan with survey line locations, raw shot gathers for quality assurance, processed velocity tomograms in colour contour format, interpreted geological sections with annotated boundaries, and a technical narrative that ties the seismic velocities to the BGS mapped formations and any available borehole logs. Where the data supports it, we provide rippability classifications per CIRIA C574 and Vs30 calculations for seismic site class assignment.